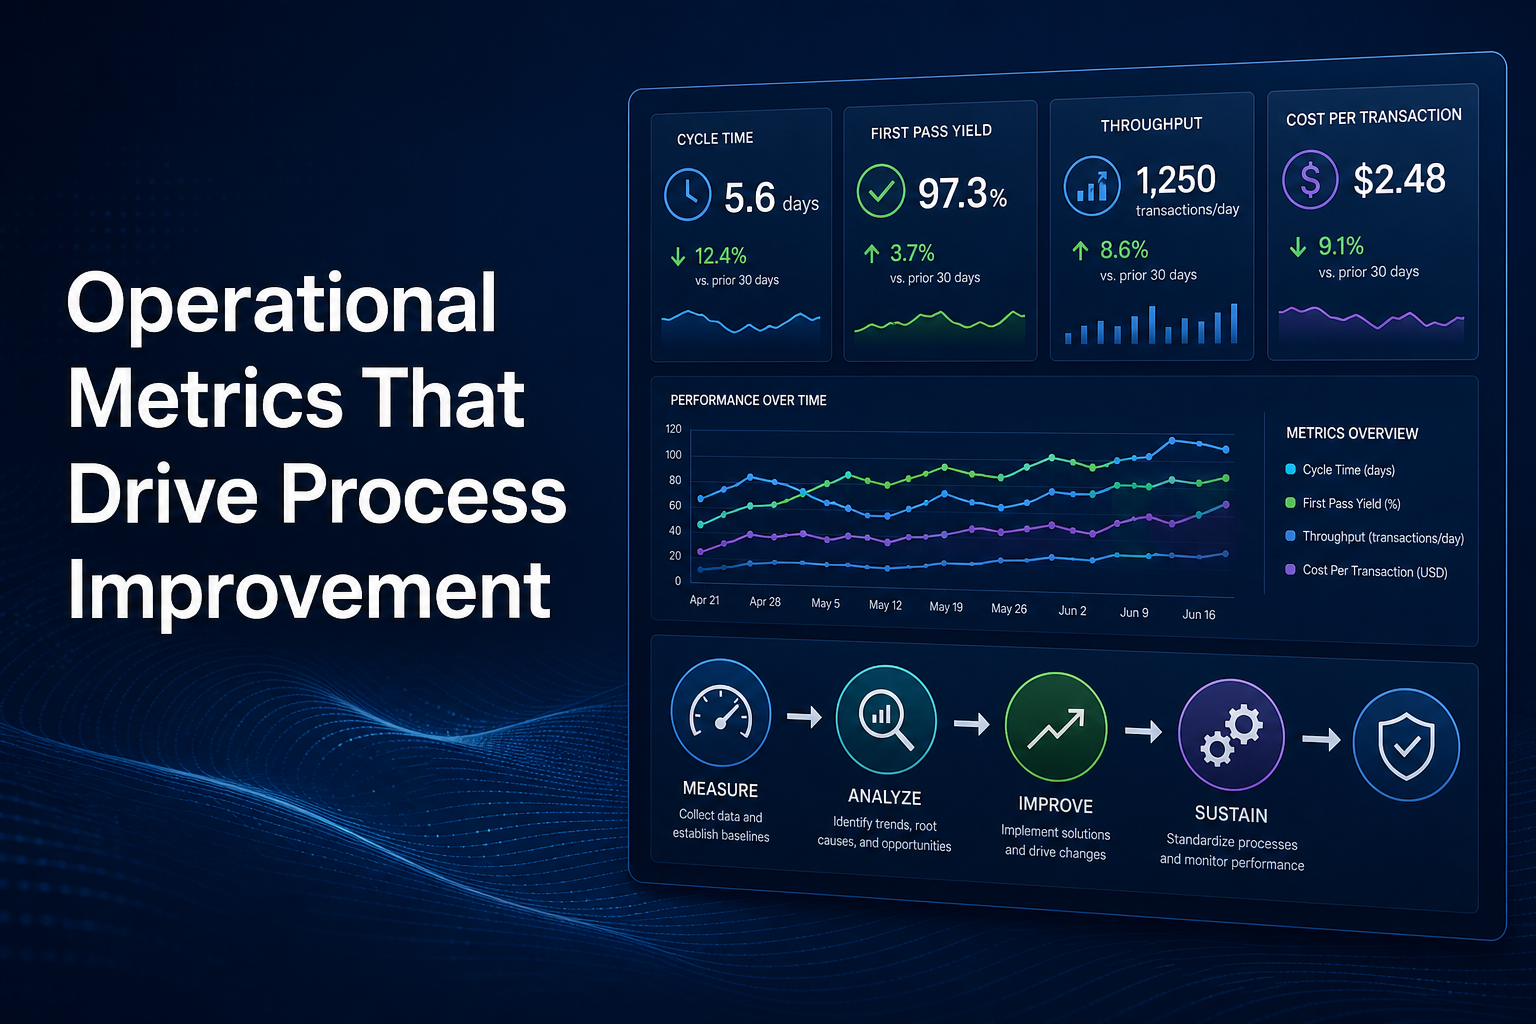
Process improvement without measurement is guesswork. But measurement without purpose creates reporting burden, gaming behaviour, and dashboards nobody trusts. The difference lies in choosing operational metrics that reflect how work actually flows, expose constraints, and give teams a clear target for improvement.
This article identifies the metrics that matter most, explains how to collect them practically, and shows how to connect measurement to action. For hands-on support, see our business process optimisation service.
Why most operational dashboards fail
Many organisations track activity rather than outcomes. They count tickets closed, emails sent, or hours logged — metrics that rise when people work harder but say nothing about whether customers received value faster or more reliably.
Common failure patterns include:
- Too many metrics — when everything is measured, nothing is prioritised
- Lagging indicators only — monthly revenue or satisfaction scores tell you what happened, not what to fix today
- Metrics teams cannot influence — holding a support team accountable for company-wide NPS demotivates rather than drives improvement
- Inconsistent definitions — "resolution time" calculated differently by each team makes comparison meaningless
- Data collected manually — spreadsheet-based reporting is always out of date and prone to error
Effective measurement starts with a small set of metrics tied directly to process performance and owned by the people who can change the process.
The core metrics for process improvement
Regardless of industry, five metric categories cover most operational processes:
- Cycle time — elapsed time from request to completion, including waiting. This is the single most revealing process metric because it captures both work duration and queue delays.
- Throughput — volume of work completed per unit of time. Rising throughput without rising cycle time indicates genuine capacity improvement.
- First-time-right rate — percentage of work completed without rework, escalation, or return. High rework rates often indicate upstream process gaps rather than individual error.
- Backlog / WIP — number of items waiting at each stage. Growing backlog signals a bottleneck; shrinking backlog with stable demand signals improved flow.
- Cost per transaction — total effort (staff time, system cost, rework) divided by volume. Essential for building the business case for improvement.
Supplement these with quality metrics relevant to your context — defect rate, compliance exceptions, customer complaints per hundred transactions — but resist adding more until these five are measured consistently.
Leading vs lagging indicators
Lagging indicators confirm results after the fact. Leading indicators predict whether results will improve or deteriorate. Both have a role, but process improvement depends on leading indicators that teams can act on weekly.
Examples of useful leading indicators:
- Average queue age at the approval stage (predicts future cycle time spikes)
- Percentage of requests arriving with complete information (predicts rework rate)
- System availability during peak hours (predicts throughput drops)
- Training completion rate for new process procedures (predicts error rates in the following month)
Review leading indicators in weekly operational meetings. Reserve lagging indicators — customer satisfaction, cost savings, revenue impact — for monthly or quarterly reviews to validate that process changes are delivering business outcomes.
How to measure without over-engineering
Perfect data is the enemy of useful data. Start with what you can collect reliably, then refine:
- Mine existing systems first — ticket timestamps, ERP transaction dates, and workflow tool audit logs often contain enough data for cycle time and backlog analysis without new tooling
- Sample when volume is high — auditing 50 random transactions per week gives statistically useful insight for most SME processes
- Define metrics precisely — document exactly when the clock starts and stops. "Cycle time" from request submission to customer notification, not from assignment to closure
- Automate incrementally — a simple report from your service desk or ERP beats a manual spreadsheet updated monthly
- Visualise trends, not snapshots — a four-week moving average reveals direction; a single week's number invites overreaction
Connecting metrics to improvement actions
A metric without a response plan is decoration. For each tracked metric, define:
- Target — what "good" looks like, based on customer expectations or historical best performance
- Threshold — the point at which the team investigates rather than monitors
- Owner — one person accountable for the metric, not a committee
- Response playbook — when cycle time exceeds threshold, the team runs a root cause analysis using a standard method (Five Whys, fishbone, process walk)
When a process change is implemented, track the metric for at least two full business cycles before declaring success or failure. Short-term spikes during transition are normal; sustained trend change is the signal.
Metrics by process type
While the core five apply broadly, emphasis shifts by process category:
- Customer-facing service processes — prioritise cycle time, first-contact resolution, and backlog age. Customers experience wait time, not internal efficiency.
- Back-office transactional processes — prioritise throughput, error rate, and cost per transaction. Volume and accuracy drive operational economics.
- Approval and governance processes — prioritise queue age at each gate and escalation rate. Slow approvals often indicate unclear criteria, not slow decision-makers.
- Onboarding and provisioning — prioritise end-to-end cycle time and handoff completeness. Incomplete handoffs between teams are the most common hidden delay.
Conclusion
Operational metrics drive process improvement when they are few, clearly defined, owned by the right teams, and linked to specific response actions. Start with cycle time, throughput, first-time-right rate, backlog, and cost per transaction. Add leading indicators that predict problems before customers feel them. Measure pragmatically from existing systems, review trends weekly, and treat every threshold breach as a trigger for investigation — not blame. That discipline turns data into improvement rather than reporting for its own sake.
Need help measuring what matters?
We define operational metrics, build measurement frameworks, and connect data to process improvements that deliver measurable results.