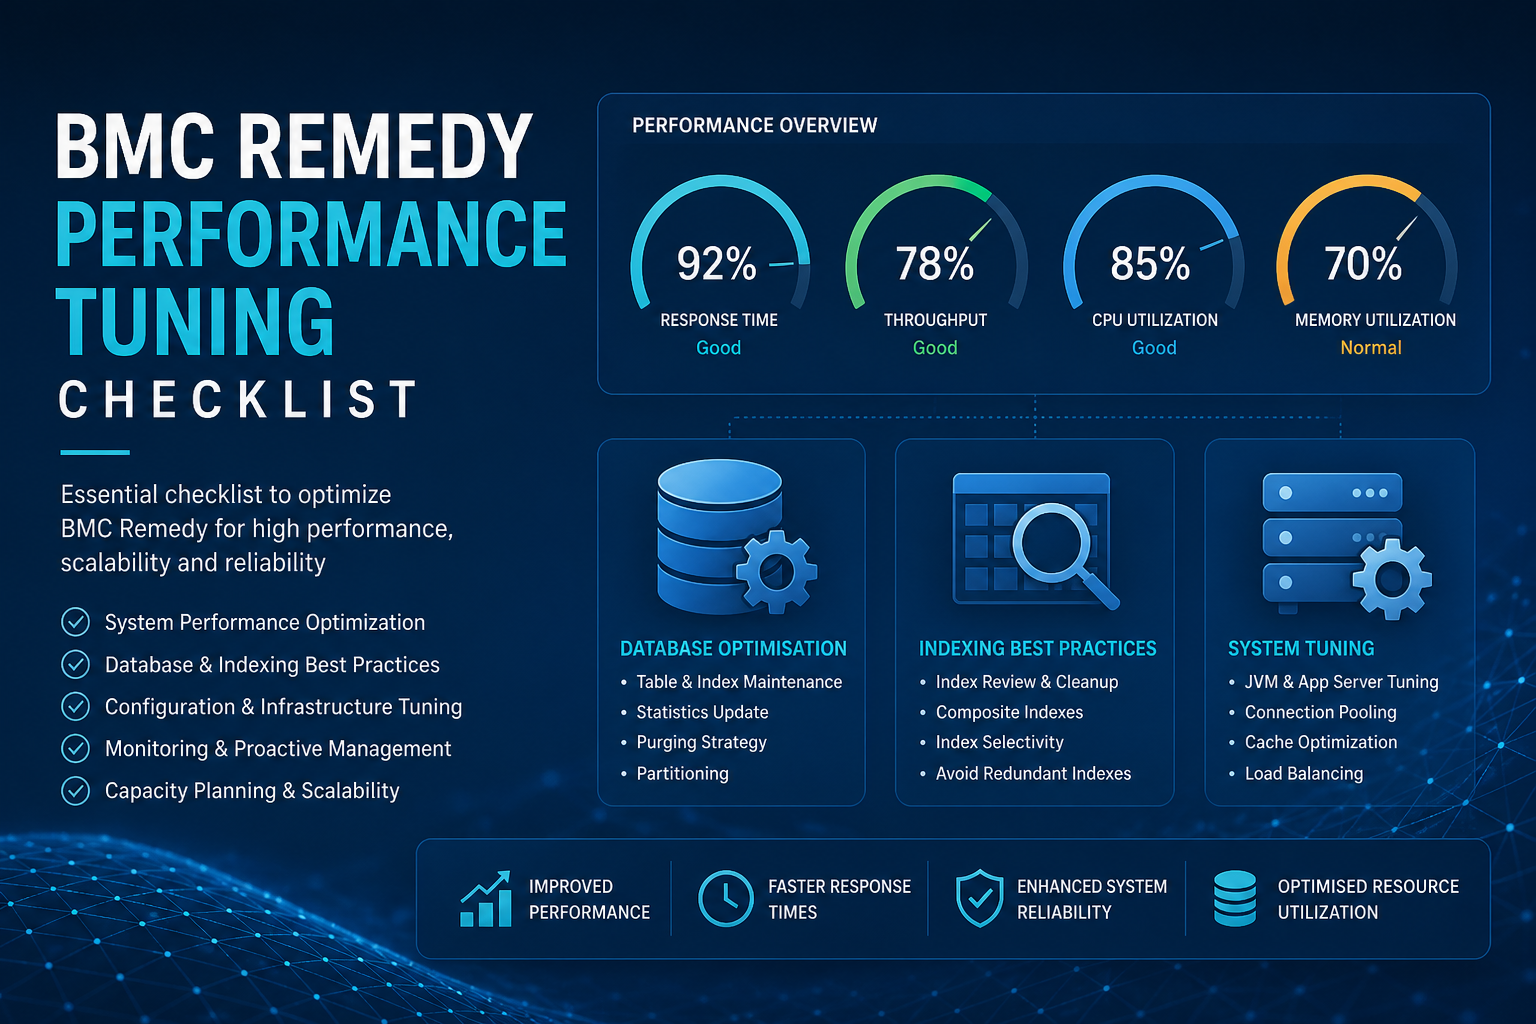
BMC Remedy (AR System) performance depends on the interaction between application configuration, customisations, and underlying infrastructure. Tuning without a methodical approach leads to random configuration changes that help one area and hurt another. Work through this checklist in order — infrastructure and database first, then application layer, then customisations.
For specialist support, see our BMC Remedy & Helix service, and read our BMC Remedy container migration guide if infrastructure modernisation is part of your performance strategy.
Establish a performance baseline
Before changing anything, capture current performance metrics so you can measure improvement:
- Average and 95th percentile response time for key forms (Incident, Change, Work Order)
- AR Server API call volume and queue depth during peak hours
- Database query execution times for the slowest recurring queries
- Filter and escalation execution counts and average duration from AR Server logs
- Mid-tier and server CPU, memory, and disk I/O utilisation under normal load
- Concurrent user count at peak and average
Enable AR Server logging at appropriate levels temporarily if current diagnostics are insufficient. Disable verbose logging after baseline capture to avoid log volume impact.
Database layer checks
The database is the most common bottleneck in mature Remedy environments. Review these items:
- Index health — verify indexes exist on frequently queried fields, especially status, assignee, submit date, and company. Run index analysis and rebuild fragmented indexes on SQL Server or Oracle as appropriate.
- Statistics freshness — ensure database statistics are updated regularly. Stale statistics cause the query optimiser to choose poor execution plans.
- Table growth — audit tables (Txxx), history tables, and attachment storage grow indefinitely unless archived. Implement or verify archive policies for records beyond retention requirements.
- Long-running queries — identify queries exceeding threshold (typically over five seconds) using database monitoring tools. Common culprits are unqualified searches on large forms and reports without date filters.
- Connection pooling — verify AR Server database connection pool settings match current load. Too few connections cause queuing; too many can overwhelm the database.
- Tempdb / tablespace — monitor temp database usage on SQL Server during peak. Spikes often correlate with large search results or sorting operations.
AR Server configuration
Server-level settings significantly affect throughput and responsiveness:
- Thread pool sizing — review fast, list, and admin thread counts against current concurrent user load and API volume. Undersized thread pools cause request queuing.
- Cache settings — verify form, filter, and escalation caches are enabled and sized appropriately. Cache misses force repeated database reads.
- RPC queue configuration — ensure remote procedure call queues are not bottlenecked. Monitor queue wait times in AR Server statistics.
- Logging level — confirm production servers are not running at debug or trace logging levels. Excessive logging degrades performance measurably.
- Plugin server health — check AR Filter and AR Email Engine plugin server responsiveness. Slow plugins block filter execution chains.
- Version currency — confirm AR Server platform version includes latest patch sets. BMC regularly addresses performance issues in cumulative patches.
Filter, escalation, and workflow review
Custom workflow is the second most common performance drain after database issues:
- Audit all active filters — list filters by execution frequency and average duration. Disable or optimise filters that fire on every transaction but add minimal value.
- Check for recursive filters — filters that trigger field updates which re-trigger the same filter create loops that degrade performance and cause unpredictable behaviour.
- Review Set Fields actions — filters performing database lookups (SQL commands, API calls) on every save are expensive. Cache results or move to batch processing where possible.
- Escalation scheduling — stagger escalation schedules to avoid all jobs firing simultaneously. Review escalation pools and ensure adequate threads are allocated.
- Active link analysis — active links with complex qualification queries on large forms slow form load. Simplify qualifications and limit active link scope.
- Remove orphaned workflow — filters and escalations from decommissioned integrations or processes often remain active. Clean up unused workflow objects.
Mid-tier and client layer
User-perceived performance depends on the full stack, not just AR Server:
- Mid-tier JVM tuning — verify heap size, garbage collection settings, and connection pool configuration. Memory pressure causes mid-tier restarts and session loss.
- Load balancer health — confirm session affinity and health check configuration if running multiple mid-tier instances.
- Form view optimisation — reduce the number of fields displayed on default views. Large forms with hundreds of visible fields load slowly regardless of server performance.
- Attachment handling — large attachments stored in-database degrade query performance. Consider external attachment storage if not already configured.
- Network latency — measure round-trip time between client, mid-tier, AR Server, and database. Geographic separation adds latency that no server tuning eliminates.
Infrastructure and capacity
Ensure the underlying platform can support current and projected load:
- CPU and memory headroom — sustained utilisation above 70% during peak indicates capacity constraints. Plan scaling before users experience degradation.
- Disk I/O — database servers on shared storage or under-provisioned disks are a frequent bottleneck. Monitor IOPS and latency, not just capacity.
- Separate tiers — co-locating AR Server and database on the same host saves cost but limits scalability. Separate tiers when performance requirements increase.
- Container and cloud readiness — if migrating to containers or cloud, performance characteristics change. Test thoroughly rather than assuming like-for-like performance.
Ongoing monitoring and maintenance
Performance tuning is not a one-off project. Establish recurring practices:
- Monthly review of AR Server statistics and slow query reports
- Quarterly filter and escalation audit — disable unused workflow, optimise high-frequency filters
- Archive job verification — confirm scheduled archive processes complete successfully
- Capacity review aligned with user growth and transaction volume trends
- Document all configuration changes with before/after metrics
Conclusion
BMC Remedy performance tuning follows a clear priority: baseline first, then database, then server configuration, then workflow customisations, then client and infrastructure layers. Most environments see significant improvement from index maintenance, archive management, and filter optimisation alone — without hardware investment. Work through this checklist methodically, measure each change, and build monitoring into regular operations so performance does not silently degrade again.
Remedy performance keeping you up at night?
We diagnose AR System bottlenecks, tune database and workflow layers, and prepare Remedy environments for migration to modern infrastructure.